New gas cost proposal for EIP-7904
New gas cost proposal for EIP-7904
This is an automated report generated from the script ./src/estimate_7904_repricings.py.
The script uses the runtime estimation output generated by this script.
The report with the runtime estimation results can be found in
./reports/eip-7904/2026-01-15_2026-01-29/runtime_estimation_autogenerated_report.md.
Methodology
New gas costs are calculated using an anchor rate of 60 million gas per second, which represents a target execution rate for EVM operations. The formula used is:
new_gas = (anchor_rate * runtime_ms) / 1000
Where runtime_ms is the estimated runtime in milliseconds from the regression models.
Understanding the results
The table below shows the worst-case gas costs across all tested clients (taking the maximum estimated cost per operation). This conservative approach ensures that the new gas costs account for the slowest implementation among the major Ethereum clients.
The Change column shows the relative change as a decimal (e.g., 1.0 = 100% increase, 0.5 = 50% increase,
-0.25 = 25% decrease). Operations with inf indicate costs going from 0 to a positive value.
Only operations and parameters with good model fits (R² > 0.5 and p-value < 0.05) are included in the gas cost proposals. Operations with poor model fits are listed separately in the “Errors and caveats” section.
New gas proposal
The following table shows the new gas cost for all operations and parameters with a good model fit.
| Opcode | Parameter | Current Gas | New Gas (Rounded) | Change |
|---|---|---|---|---|
| ADDMOD | constant | 8 | 8 | 0.0 |
| BLAKE2F | constant | 0 | 170 | inf |
| BLAKE2F | num_rounds | 1 | 2 | 1.0 |
| BLS12_G1ADD | constant | 375 | 643 | 0.71 |
| BLS12_G2ADD | constant | 600 | 765 | 0.27 |
| DIV | constant | 5 | 15 | 2.0 |
| ECADD | constant | 150 | 314 | 1.09 |
| ECPAIRING | constant | 45000 | 34710 | -0.23 |
| ECPAIRING | num_pairs | 34000 | 34103 | 0.0 |
| ECRECOVER | constant | 3000 | 2904 | -0.03 |
| KECCAK256 | constant | 30 | 45 | 0.5 |
| KECCAK256 | msg_size | 6 | 1 | -0.83 |
| MOD | constant | 5 | 12 | 1.4 |
| MULMOD | constant | 8 | 11 | 0.38 |
| POINT_EVALUATION | constant | 50000 | 89363 | 0.79 |
| SDIV | constant | 5 | 20 | 3.0 |
| SMOD | constant | 5 | 3 | -0.4 |
Gas costs by client
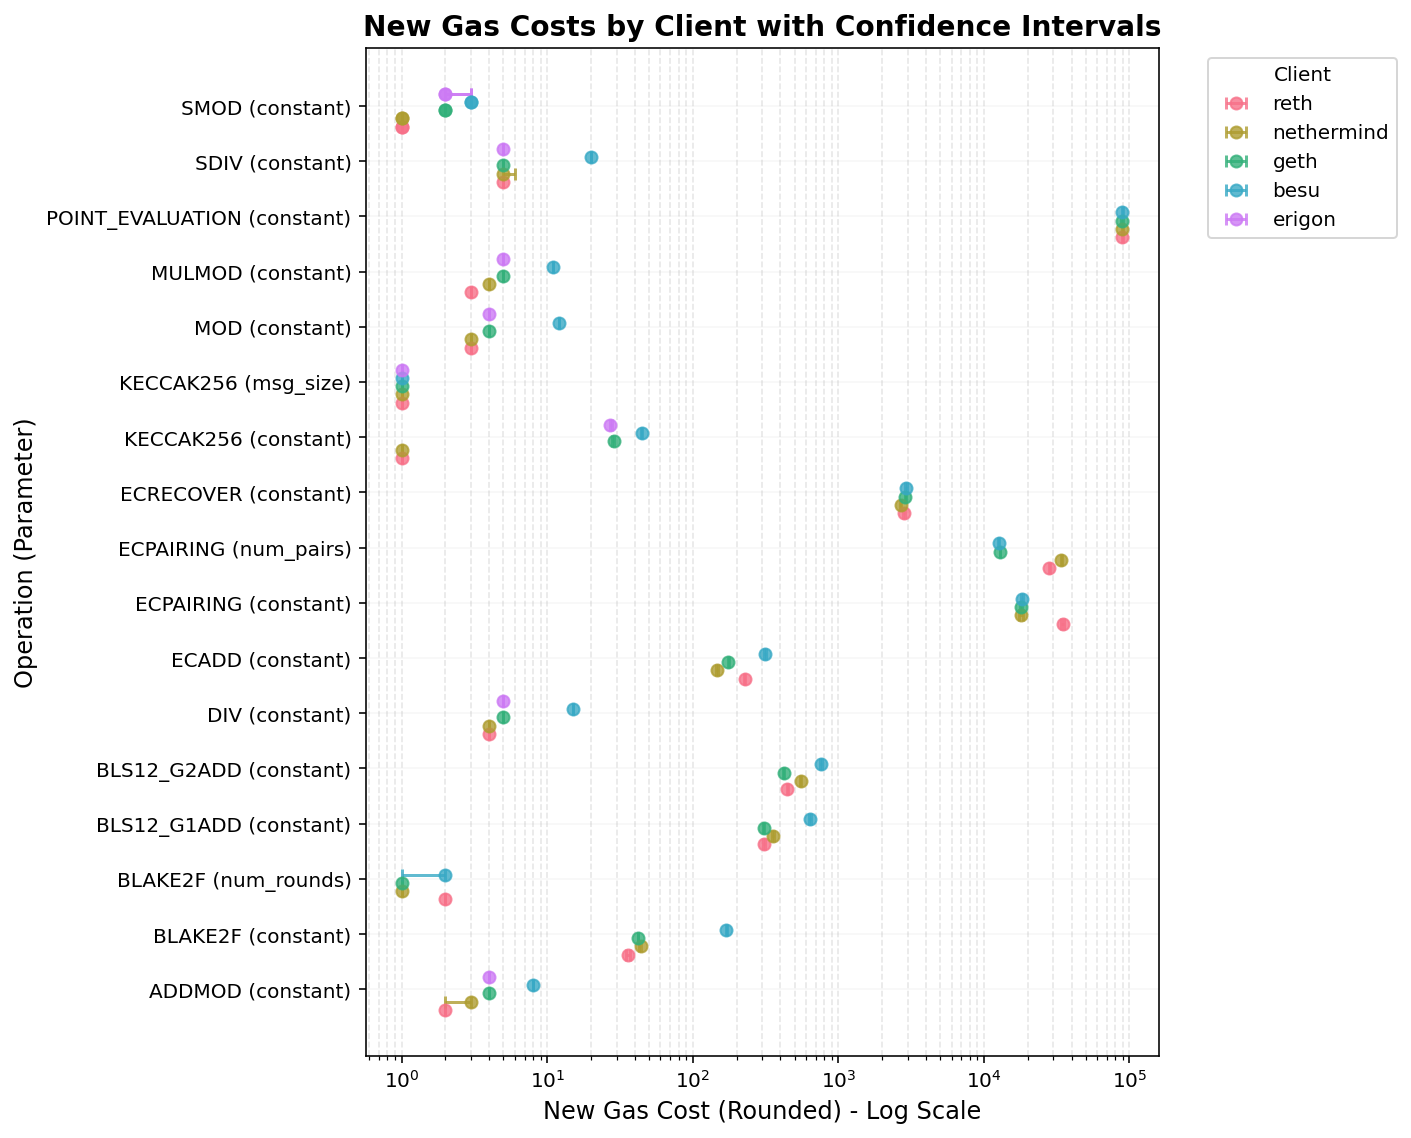
The following plot shows the new gas costs (rounded) for each operation parameter across different clients, with error bars representing the confidence intervals.
Errors and caveats
All parameters had a good model fit.
The following operations have no estimation for the following clients:
-
BLAKE2F: erigon
-
BLS12_G1ADD: erigon
-
BLS12_G2ADD: erigon
-
ECADD: erigon
-
ECPAIRING: erigon
-
ECRECOVER: erigon
-
POINT_EVALUATION: erigon